Categories
Data reviewer
Review and resolve data issues through automatic detection.
Updated: December 2023
Table of contents
Reviewing and resolving issues
Overview
This feature helps you identify and resolve data quality issues with your emissions inventory monthly inputs in one place, allowing you to identify and resolve issues efficiently. Data issues including anomalies, gaps, and duplicate data entries are automatically flagged and we provide tools to help you resolve them.
How-to guide
Setting up the Data reviewer
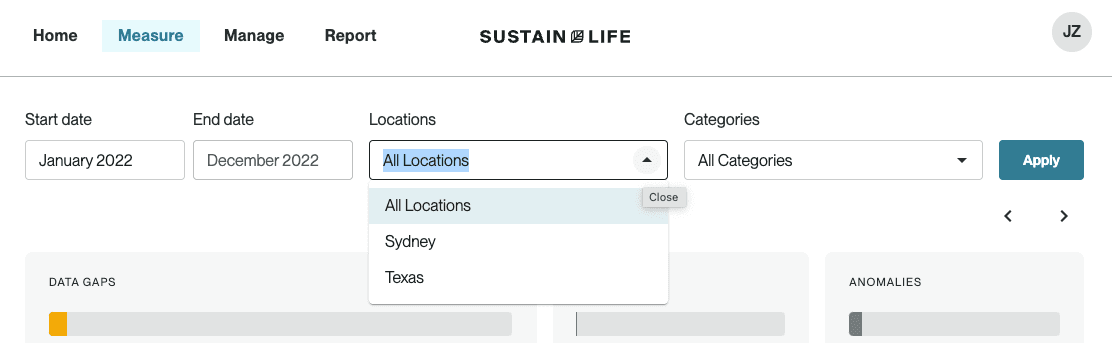
First, navigate to this feature under Measure > Data reviewer. Here, you'll see all of the data you've entered across categories and locations in one place, along with your high level emissions results.
Choose the Start date for the time period you'd like to review. Based on your start date, the End date will be populated automatically to be 12 months later.
All Locations and Categories are selected by default, but you can also filter to specific ones for a more targeted review. Once you've configured your settings, click Apply to load your data and issue flags. Your settings will be saved for your next session.
Identifying data issues
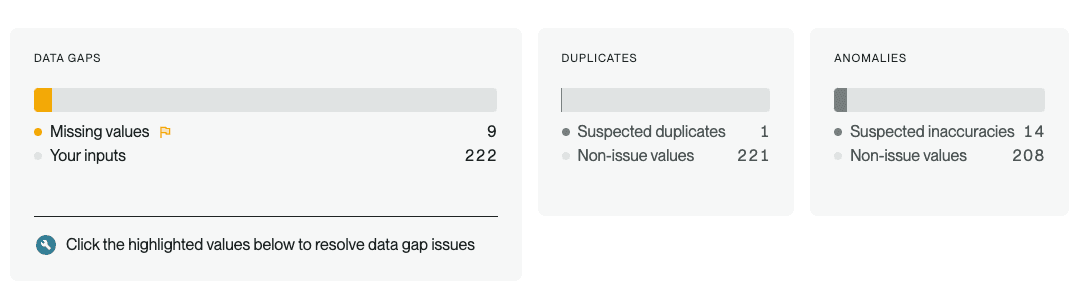
Once your data table loads, you will see 3 cards at the top representing the 3 types of data issues:
- Data gaps: Missing entries for sources where you've previously added data or indicated that a source is relevant in your category settings
- Duplicates: Multiple entries where you've entered the same value for a given month, location, and source
- Anomalies: Entries with inputs exceeding expected bounds we've calculated based on other inputs for that same source and location
Data gaps will be selected by default and show in the expanded state below. You can also click on the "Duplicates" or "Anomalies" card (or click the arrow buttons) to highlight those issue types instead.
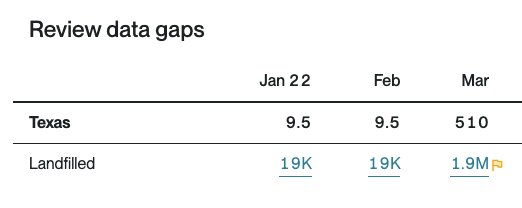
Each card will contain a bar representing the total number of inputs, with the flagged inputs appearing as a segment of the bar in orange. For example, below, you see that under "Data gaps", you have 9 missing values and 222 inputs that are not missing. As you click on each card, the card will expand in dwidth and the segment of the bar representing the flagged issue will be shown in orange.
Reviewing and resolving issues
Use the Data reviewer feature to identify the quantity of data issues and to track your progress in fixing them. Once no remaining flags appear in the table, you have completed your review.
Data gaps
Click the "Data gaps" card to see flagged entries. To filter the data table to only rows with flags for easier use, click the flag icon to the upper right of the table.
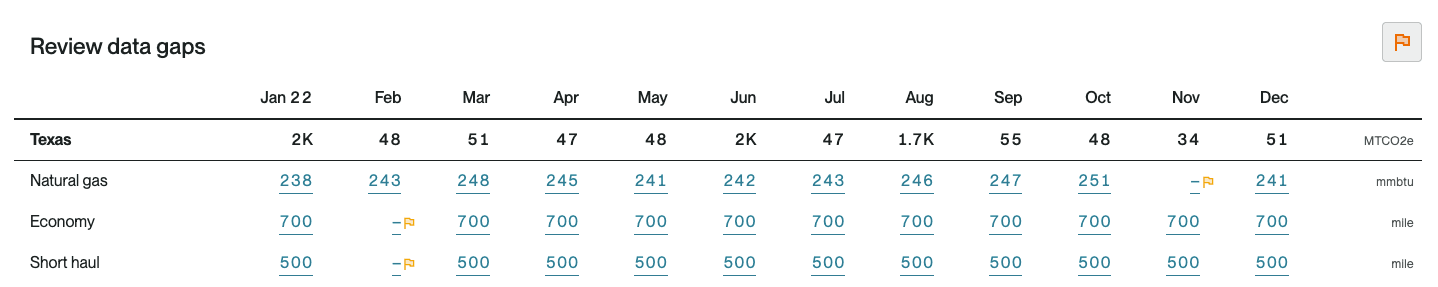
Click on an entry in the table marked with the orange flag icon. This will open the affected entry in a modal where you can review and fix your input data.
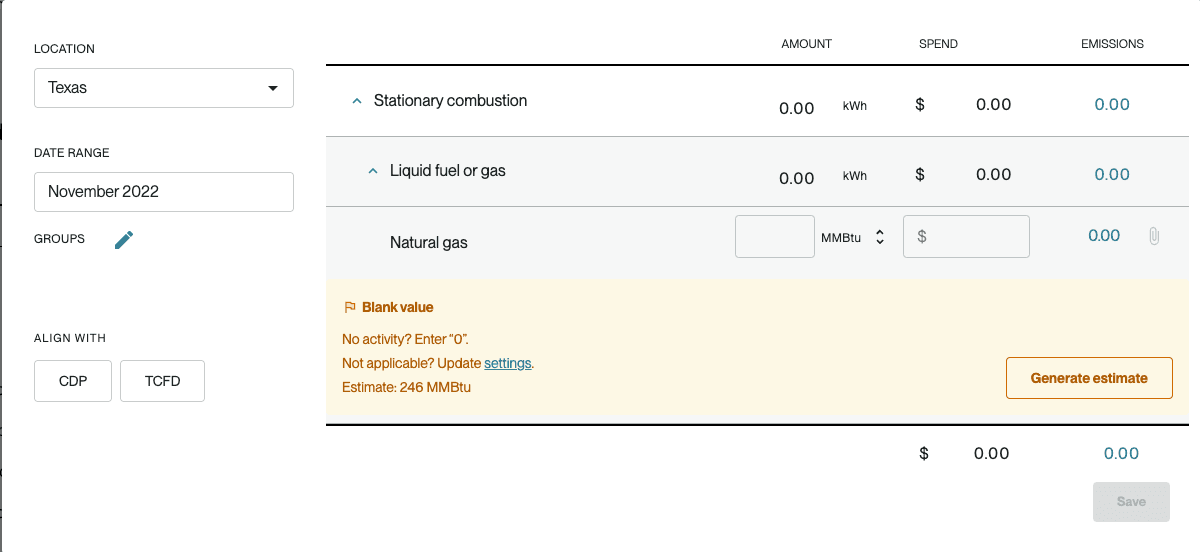
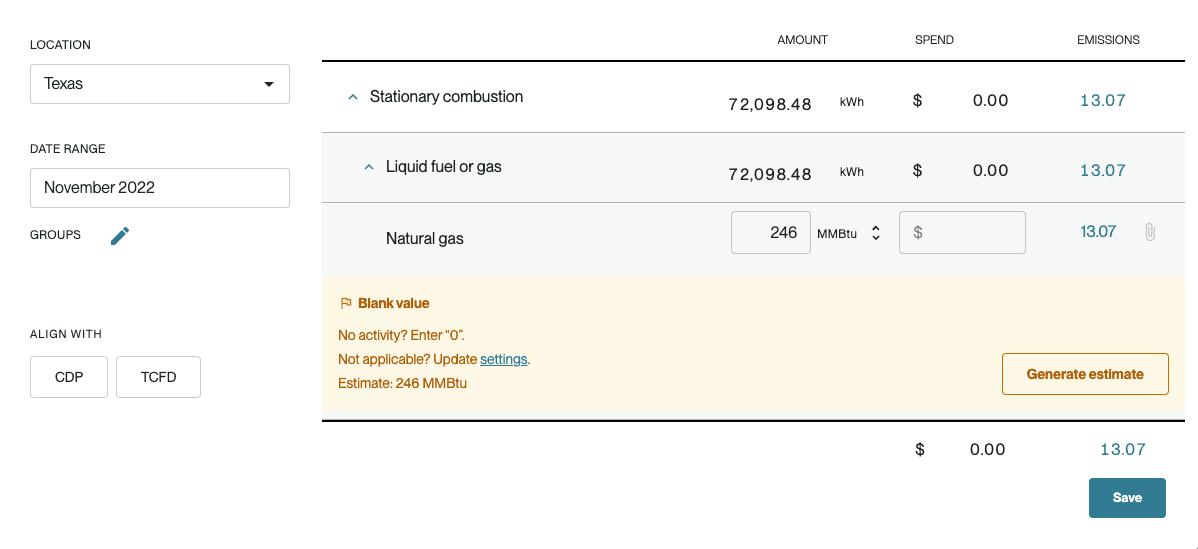
To resolve the data gap issue, you can take one of three actions:
- If there was truly no activity for this period, enter 0 to explicitly mark it as such.
- If this activity type is no longer applicable to this location, click settings which will take you back to the relevant page where you can adjust your location preferences for this category.
- If there was activity for this period, but you are unable to fill in the primary data (e.g., you are missing a utility bill for this month), Workiva Carbon can generate an interpolated estimate for you. Click Generate estimate to fill the amount field with an estimate based off of the rest of your recorded data for this activity type and then click Save.
After you take an action on an entry, the flag will be removed.
Duplicates
Click the "Duplicates" card to see flagged entries. To filter the data table to only rows with flags for easier use, click the flag icon to the upper right of the table.
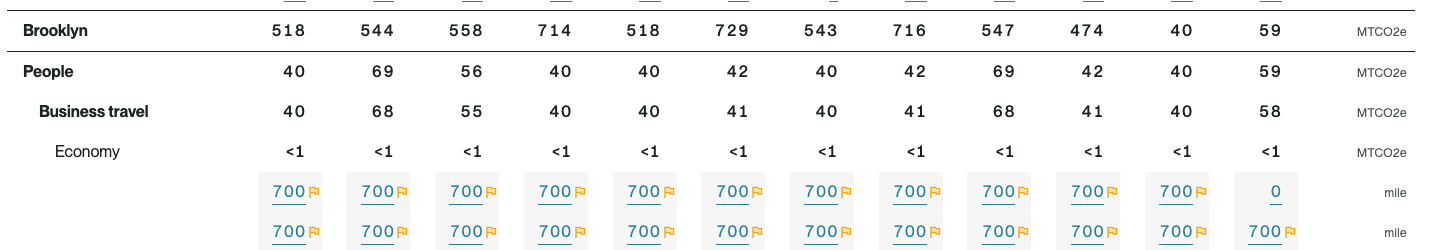
Duplicates will appear in multiple rows in grey under the same activity type, month, and location.
When you click on a flagged input, the corresponding data entry will open up in a modal with a message under the affected line item.
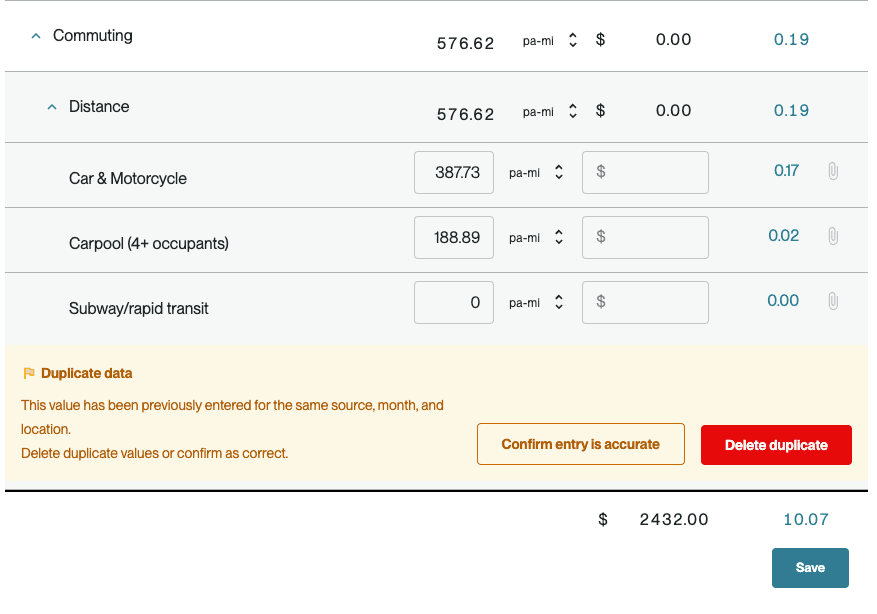
If the data is a duplicate and needs to be removed, click Delete duplicate, which will zero out the input field. Then click Save.
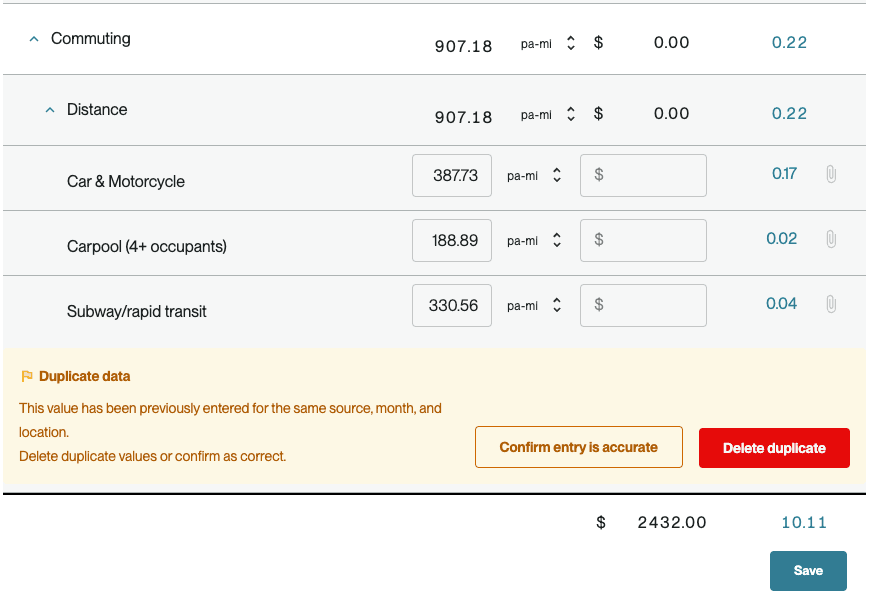
If it is not actually a duplicate, then click Confirm entry is accurate and then Save. This will retain the data as is but remove the duplicate flag.
Anomalies
Click the "Anomalies" card to see flagged entries. To filter the data table to only rows with flags for easier use, click the flag icon to the upper right of the table.
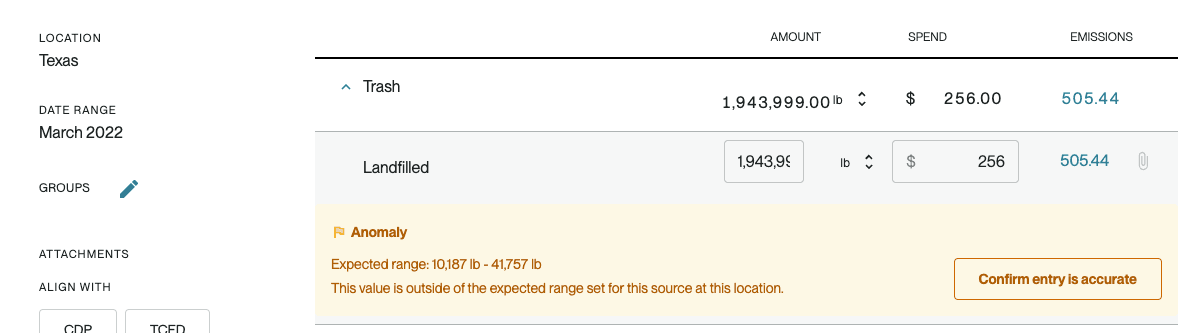
When you click on a flagged input, the corresponding data entry will open up in a modal with a message under the affected line item.
If the input data is incorrect and needs to be fixed, change the value in the amount field, wait for the emissions to recalculate, and then click Save. If the input data is correct, click Confirm entry is accurate and then Save, which will retain the data as is but remove the anomaly flag.
FAQs
What types of common data issues does this feature help me address?
First and foremost human error, especially when enter data manually doing things like adding an extra zero or uploading the same entry twice and effectively doubling your consumption.
Then we have just the problem of missing data, perhaps you can’t track down that last fuel invoice for a month or you want to use some representative data while you get data from your suppliers. So it’s not that you had zero consumption or activity, you just don’t have the data.
And finally, big spikes or dips in your activity data can be indicative of operational problems. Knowing when these spikes or dips occur can help you pinpoint operational issues that are impacting your emissions. This kind of automated anomaly detection highlights deviations outside of your historic norms.
Why is it important to address data issues?
Data accuracy in reporting is important for a few different reasons. First, it’s a part of maintaining accountability and credibility over the numbers that you publish. Catching problems early ensures your don’t have to restate or make corrections to your inventory from data problems. It’s also critical because you always want to be taking action on the highest quality data possible. If you’re going to be setting targets against your inventory, investing resources into hitting those targets and then reporting your performance on those publicly – you want to know that the numbers you’re working off of are sound. Lastly, new regulations are coming out that expect some level of assurance, which means a third part auditor is going to be combing through your activity data, your internal controls and your emissions outputs, and you'll want your data in tight form prior to bringing in that reviewer.
When should I use this feature?
You can use this feature at any time after entering data, but it is most important to review and fix errors ahead of any kind of third party verification or assurance, setting a reduction target, or publishing your data (e.g., through external disclosure or sustainability reporting).
When should I utilize Workiva Carbon's estimate to fill gaps? How is the estimate generated?
If you have access to primary data, you should prioritize using that first. But if you have primary data for other months, but are just missing it for specific months (e.g., due to a missing utility bill or incomplete source data), we can help you fill the gap using our interpolation logic.
The interpolation logic calculates the logic from the average of the entry's neighboring values, or the most recent preceding month and the earliest following month.
If there are no neighboring values to interpolate from, no estimate can be generated. In this case, find the primary data if you can or utilize the estimation toolds available in the Manage > Downloads section of the Workiva Carbon application.
I see that one of my inputs has been flagged as an anomaly, but the data looks accurate. Why would it be flagged?
Our anomaly detection logic is based on bounds that we've set to maximize error detection while minimizing false positives, as well as the data you've entered for a given activity type and location. This kind of automated anomaly detection highlights deviations outside of your historic norms.
Primarily, you can use our anomaly flags to determine where you have entered inaccurate data and then fix the issue. But it's also possible that an entry is flagged as an anomaly, despite not being a mistake. In this case, you can confirm that the entry is already accurate and we will remove the flag. But it's still helpful to know that big spikes or dips in your activity data can be indicative of operational problems. Knowing when these spikes or dips occur can help you pinpoint operational issues that are impacting your emissions.
Copyright 2026 Sustain.Life All rights reserved